Choosing a starting point is important. For example, Government Budget Deficit is a bad choice, a lot of works with few progress. We will know the reason later when we have understood the working of the globalization process thoroughly.
How to choose a good starting point? "Make careful observations".
We made the following observation:
Main stream macro-economic models had performed quite well from 1950s through early 1980s. Then they have failed test after tests starting from 1980's.
What kind of failures are we talking about?
Question: What has happened since 1980's that have made such a big difference for the main stream models?
Answer: It is "globalization".
Question again: What is the "thing" in the "globalization" that have made such a difference for mainstream models?
Answer: It is "The Runaway U. S. Trade Deficit". With this observation, we have chosen "The Runaway U. S. Trade Deficit" as our starting point.
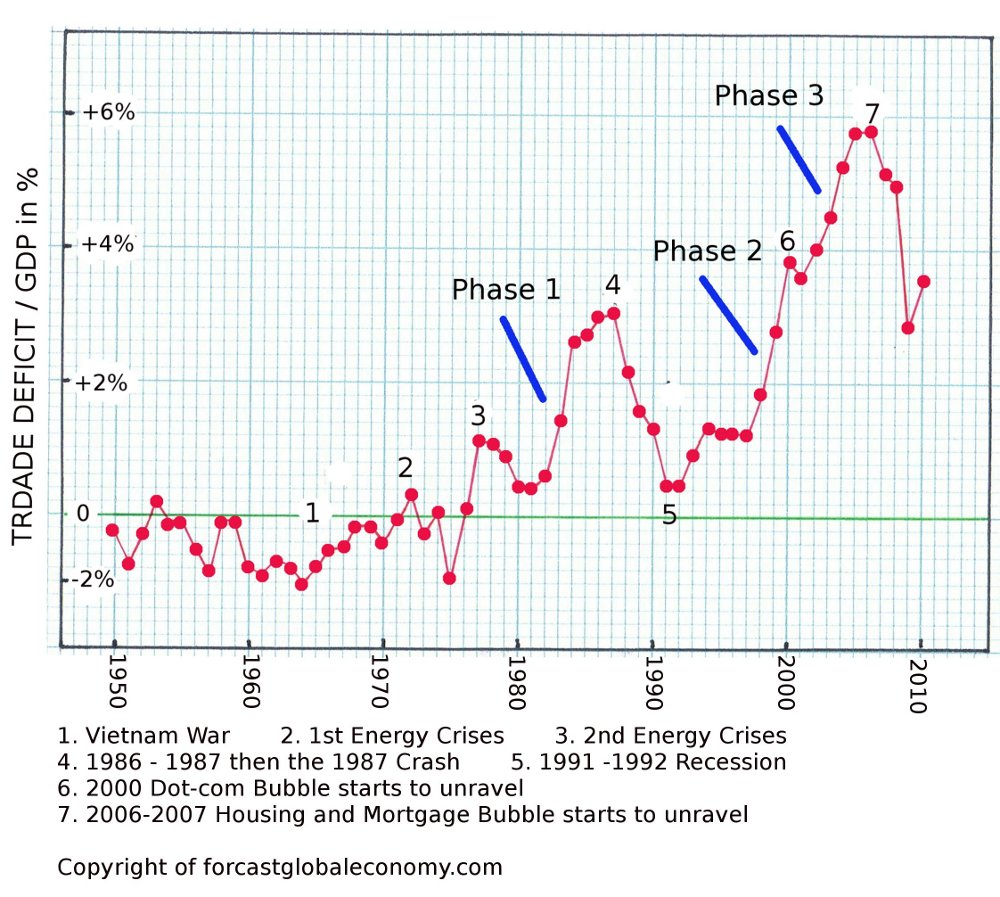
Any financial bubble requires ever increasing influx of money to sustain. When the amount of incoming money stagnates, the bubble will unravel. Since the bubbles in the globalization era are generated and sustained by the flow-back dollars originating from the runaway U. S. trade deficit, as the trade deficit peaked, bubbles started to unravel. That is why the peaks of trade deficit like points 4, 6 and 7 in the graph indicate the beginning of the end of those bubbles.
To foretell when the peaks of the trade deficit will come:
With the complete understanding of the working of the globalization process, three case studies (just for reading), phase 1, phase 2, and phase 3 of runaway trade deficits are studied in details in Section 5, 6, and 7 respectively. Why Dollar changes directions to cause runaway trade deficits is discussed in those sections for each phase, too.
At early part of 1980s when Reagan administration pushed earnestly for globalization by reducing barriers that hinder the movement of goods and capital across national boundaries, Japan was in the phase of rapidly rising productivity. Thus Japan started to run substantial amount of trade surplus with The U. S. On the other hand Reagan administration's expanded military buildup created huge government budget deficit that must be covered by the increased issuance of U. S. Treasuries. Having learned the harsh lesson of high inflation of 1970s, Reagan administration did not ask FED (The Federal Reserve) to create money to accommodate the increased issuance of Treasuries, but just sold those Treaesuries into the open market. As the result the yield of Treasuries rose and exceeded the rate of inflation by a large margin, creating an ideal situation to buy Treasuries. When U. S. runs trade deficits with Japan, Japanese manufacturers get dollars, but they must sell those dollars for Yen in order to continue to operate in Japan since Dollar is not the legal tender there. Usually such selling of dollars will push up Yen vs. Dollar. But Japanese financial entities eagerly bought up those dollars to buy U. S. Treasuries. Thus in spite of U. S. trade deficit with Japan, Yen did not rise against Dollar, so U. S. trade deficit with Japan expanded rapidly.
Flow-back dollars from the massive trade deficit with Japan was used to finance corporate raiding and leveraged-buyouts, causing the stock prices of those targeted company to skyrocket and in turn boiled up the whole stock market. When a company was taken over, the raider used the asset of the company to issue large amount of high yielding junk bonds to pay off existing stock holders and to secure operating funds for the company. That is why we call Reagan era stock market bubble as the "Junk Bond Bubble".
Under severe complaint from domestic manufacturers hurt by the massive Japanese import, in early 1985 Reagan Administration held a conference with major industrial powers at Lake Placid, New York. In the conference it was decided that U. S. and Japanese Governments jointly intervene in the currency market to bring down U. S. Dollar against Japanese Yen. The Dollar-Yen exchange rate tumbled from over 220 Yen per Dollar to 120 Yen per Dollar within a short time period. With above mentioned two year lag, at the end of 1986 U. S. trade deficit finally peaked. With the peaking, the amount of money flowing into the Junk Bond Bubble stagnated and the bubble started to unravel. By the fall of 1987, big boys on Wall Street started to realize that the sky was falling and rushed to the exit at once, causing the crash of 1987.
Junk Bonds usually mature in 3 to 5 years. At the time of 1987 crash, the companies that were taken over still had plenty of cash at hand to continue their operation. So U. S. economy galloped along in spite of the stock market crash. By 1991 U. S. trade deficit had shrunk substantially under the weight of the mighty fall of Dollar vs. Yen. At that time many junk bonds had matured but could not be refinanced since money was not there due to the shrunken U. S. trade deficit. Many junk bonds defaulted, and many saving and loans holding large amount of junk bonds were wiped out. Thus a recession finally arrived, and the first phase of runaway U. S. trade deficit had come to a bitter end.
As U. S. economy recovered from the 1991 to 1992 recession, U. S. trade deficit with Japan started to rise again. That time there was no special factor to hold back the rise of Japanese Yen like in early part of 1980s, discussed in the previous section. The free currency market took Yen higher. However, Japan was mired in domestic stagnation after the burst of a giant real-estate bubble so their manufacturers turned their attention from domestic spending to export. It proved the tide of Japanese export into U. S. difficult to contain due to Japan's rapidly improving productivity and innovation, so the free currency market pushed Yen higher and Higher. Eventually Japanese Yen rose to 80 Yen per Dollar from its stable level of 125 Yen per Dollar around 1990. In 1994 U. S. trade deficit finally peaked and started a gentle three year retreat. U. S. economic expansion had also started to slow down. Clinton Administration was worried about the chance that U. S. economy might sink into a recession before 1996 general election. By 1995 Japan had experienced 5 years of slow growth after the burst of the real-estate bubble. Whether consulted with and got the nod from Clinton Administration or not we do not know, Japanese Government took a drastic action in the middle of 1995. Japanese Government lowered interest rates to near zero, an unheard of strategy since the end of the gold standard in 1971.
Huge interest gap between Yen and Dollar due to Japan's near zero interest rate policy unleashed the torrent of Yen-Dollar carry trade. It is for large speculators to borrow Yen at near zero interest rate, sold those borrowed Yen for Dollar and invest those dollars in high yielding dollar-denominated assets. With the massive amount of Yen-Dollar carry trade Dollar naturally bounced back strongly against Yen. Yen rich Japanese financial entities, like life insurance companies, joined the game by selling Yen at hand for Dollar and invested in higher yielding Dollar-denominated instruments. Thus the rise of Dollar caught fire further. Finally Dollar rose to the level near 180 Yen per Dollar from the bottom of 80 Yen per Dollar. With the sharp rise of Dollar vs. Yen starting from the middle of 1995, U. S. trade defcit just exploded upward roughly two years from 1995. That was the Phase Two of the runaway U. S. trade deficit. Clinton Administration justified the explosive rise of Dollar and the trade deficit under the catch phrase of "Strong Dollar Policy".
During the second phase of runaway trade deficit, Wall Street speculators poured the borrowed money from the pool generated by the flow-back dollars from the runaway trade deficit into high tech stocks to cause their stock price to shoot up to stratosphere. Skyrocketing stock price of high tech companies then lifted up the whole stock market, forming a giant stock market bubble to recycle the trade-deficit-dollars back to U. S. consumers. That Clinton stock market bubble is nicknamed as the "Dot-com Bubble".
Unfortunately the explosive rise of Dollar vs. Yen had led to a severe consequence and boomeranged back to torpedo the Dot-com Bubble. Around the time of 1995, many developing countries had listened to the ill advice from some prominent main stream economists in the U. S., and pegged their currencies to U. S. Dollar rain or shine. Quite a few small Asian countries at that time were relying on the outsource of manufacturing facilities and know how from Japan to produce low end consumer goods and exported them to America to earn a tidy trade surplus. Along with the explosive appreciation of Dollar against Yen starting from 1995 as discussed before, the currencies of those Asian countries also skyrocketed up vs. Yen. The incentive for Japanese manufacturers to outsource manufacturing facilities and know how to those countries was lost. Trade surplus turned to trade deficit in those Asian countries. Those Asian countries issued sovereign bonds denominated in their own currencies that were pegged to Dollar to cover the trade deficit. Though those Asian sovereign debts looks like indirectly denominated in Dollar, the market knows that they are much more risky than U. S. Treasuries, so they carried much higher yield than U. S. Treasuries. Many large speculators at that time also believed the magical words of those main stream American economists and thought that the peg to U. S. Dollar was "gold". Those speculators forgot about the golden rule of investment that higher yield always means higher risk, and eagerly snapped up those higher yielding Asian sovereign debts to enabled those countries to sell more and more sovereign debts to enjoy a brief borrowed prosperity. When one large speculators finally found that the emperor actually had no cloth and ran toward the exit, the news spread and all those speculators ran for exit at once. The currencies of those Asian countries were suddenly under heavy pressure to depreciate due to the stampede toward the exit, those countries quickly exhausted all their foreign currency reserves to defend their currencies. Their sovereign debts collapsed, not be able to refinance those debts, those Asian countries went into default one after another. That was so called "Asian Financial Crises".
At the aftermath of the crises, IMF stepped in to steady those countries and forced them to decouple their currencies from U. S. Dollar. With the decoupling, their currencies tumbled against U. S. Dollar, soon their competitive power came back and they have been saved.
The shock wave of the massive devaluation of those Asian currencies soon hit their competitors like Russia that had still pegged her currency to U. S. Dollar under the advice of those magician economists. In 1998 Russia went into default. A large hedge fund that held a huge amount of Russian sovereign debt was driven to near bankruptcy. From the fear that the fall of that large hedge fund might have triggered a domino effect and pull down the whole global financial system, Greenspan asked the big boys of Wall Street to jointly bail that hedge fund out. At that juncture Clinton Administration finally recognized the folly of "Strong Dollar Policy", and intervened in the currency market, jointly with Japanese Government, to weaken the Dollar. Thus Dollar fell quickly from near 180 Yen per Dollar to 125 Yen per Dollar. With the usual 2 year time lag, U. S. trade deficit peaked in 2000, the amount of money flowing into the Dot-com bubble stagnated, the bubble started to unravel, and a recession set in. Thus the Second Phase of runaway trade deficit also came to a bitter end, and investors, especially those bought into high tech stocks, suffered heavy losses.
By early 2000s China has replaced Japan as the number one contributor to U. S. trade deficit. After the turmoil of 1989, China devalued Chinese Yuan by a massive amount, from 3.7 Yuan per Dollar to about 8 Yuan per Dollar, and than pegged Yuan to Dollar at that massively devalued rate. Heavily under valued Yuan attracted outside capital to set up manufacturing facilities in China to produce consumer goods to be exported mainly to America. Even during the time from 1995 to 1998 when U. S. Dollar skyrocketed against Japanese Yen, Chinese Yuan's undervaluation vs. Japanese Yen was only reduced by a small fraction. Thus China was able to continue to attract outside capital without affected by Asian Financial Crises. The rapid emergence of China as the top contributor to U. S. trade deficit limited the drop of U. S. trade deficit after the burst of Dot-com bubble as shown in the graph. As U. S. economy recovered from 2000 to 2001 recession, China's contribution to U. S. trade deficit grew further. At the peak, China enjoyed $250 billion trade surplus in goods trade with The U. S., equivalent to China's total trade surplus against the whole world. In comparison U. S. deficit in goods trade vs. Japan never exceeded $90 billion. This rapid run up of trade deficit with China contributed substantially in escalating U. S. trade deficit as a whole during Bush era.
Besides the direct China effect, there was also an indirect China effect that aggravated U. S. trade deficit further. As China runs a huge trade surplus, say $250 billion a year, the influx of Dollar into the hands of Chinese manufacturers must be sold for Yuan so they can continue to operate within China. Such selling pressure of Dollar will naturally boost the value of Yuan vs. Dollar. Chinese Government wanted Yuan to be pegged to Dollar at about 8 Yuan per Dollar so Yuan will be kept at the vastly under valued level to allow China to keep exporting massively. Thus Chinese Government must buy up all the surplus dollars in the market, that is, $250 billion in total. At the exchange rate of 8 Yuan per Dollar, Chinese Government must create 2 trillion Yuan to buy up that $250 billion. As the result massive amount of Yuan liquidity floods into China's market. Various governmental and semi-governmental units, some times alone, some times in conjunction with outside capital like Hong Kong and Taiwan merchants borrowed heavily from this vast Yuan liquidity, and started rampant infrastructure construction. Such a rampant infrastructure construction required vast amount of natural resource. China has become the largest buyer of global resource to feed into its infrastructure construction boom. For example, China bought 90% of the global iron ore production, and 80% of global copper production. Especially important is China's rapid increase of crude oil consumption that contributed mightily to push up the oil price. With the high flying commodity price, U. S. trade deficit was further aggravated, and thus the third phase of the runaway U. S. trade deficit had dawned.
During the third phase of the runaway trade deficit, stock market was not large enough to recycle the vast amount of flow-back dollars generated from the runaway trade deficit back to U. S. consumers. Naturally attention was shifted to the largest lending market, the mortgage market, to do the recycling. To entice U. S. consumers to borrow more in mortgage market, the requirement of down payments of mortgage loans were steadily reduced, and eventually the down payment rate went down to 0 %; such 0 % down payment mortgage loans are called subprime mortgages.
By 2005 U. S. Senate's anger over ever increasing trade deficit vs. China boiled over. Strong words were put out to demand Chinese Yuan to appreciate by 25% against U. S. Dollar, otherwise U. S. is going to impose 25% import tariff against all made-in-China goods. Under the pressure Chinese Government finally abandoned the policy of pegging Yuan to Dollar and allowed Yuan to gradually appreciate starting from July of 2005.
China's exports are mainly labor intensive lower range consumer products, so they are more sensitive to the appreciation of Yuan than Japanese products to the variation of Yen/Dollar exchange rate. The time lag from the change of Yuan exchange rate policy to the time for the effect to show up in trade balance was shorter than the normal two years. By the end of 2006 U.S. trade deficit had peaked, the amount of money flowing into the mighty mortgage bubble waned, and the bubble started to unravel. The first financial firestorm had appeared in August of 2007 in the form of commercial paper market's boycott of the papers issued by large speculators in subprime mortgage. Then followed by the mad scramble of financial entities for liquidity at the year end of 2007, the downfall of Bear Stearns, and the demise of Fannie Mae and Freddie Mac. Finally the rout of September of 2008 that required massive money creation by FED to prevent the whole sky of financial System to collapse, otherwise the whole world would have been pushed into another great depression. By this way the third phase of the runaway trade deficit had come to an even more bitter end than its two predecessors.
With all the major macro-economic events since the start of the globalization in early 1980s explained by this scientific approach with the runaway
U.S. trade deficit as the thread, we are now ready to analyze the current status of the economy and peek into the future.
During the period when the trade deficit-generated bubbles are running, FED (Federal Reserve) will lose control of those bubbles so the bubbles will run to
their bitter
end. When the bubbles burst, the trade deficit shrink and the recessions set in, FED will regain the control, so the monetary policy created by FED will
return to the driver's seat. Today the economy is in such a FED controlled phase.
The performance of the economy does not only depend on the amount of money created by FED, but also depend on the speed of the money circulating
through the society. So we can write down an equation,
G = c • M • V, (1)
where G represents the size of the economy like GDP, M is the amount of money created by FED, V is the speed of money circulation measured as
how many times the money circulate through the society in a fixed time (officially called "the velocity of money"), c is just a constant, and "•" means
multiplication.
When the housing and mortgage bubble started to unravel, banks started to refrain from lending, so the velocity of money, V, had plunged, causing the left hand side of Equation (1), G (or GDP) to decline, too. Thus the recession set in. To counter the recession, FED has created a large amount of money to make M increase rapidly, so M • V or G (GDP) will rise again.
Let us see how much money FED has created during and after the "crash". Before August, 2007 when the first firestorm hit, total money created by FED, that is, M stood at 860 billion dollars. At June, 2011 when FED halted the creation of money, M became 2850 billion dollars, more than three times of the amount of money before the crash. Currently we are watching to see whether or not FED will create more money.
Even without further creation of more money, the bloated money creation itself has already put the economy in a dangerous situation. The reason is as follows: Suppose GDP was growing like 4% a year before the crash. If the velocity of money, V, ever returns to the pre-crash level, GDP will grow 3 times 4% = 12%, an extremely overheated condition. If that happens FED must withdraw a huge amount of money within a rather short time span to prevent the overheating of the economy. Otherwise a huge bubble will develope, and the inevitable burst of that giant bubble will certain to sink U. S. economy into a depression, pulling the global economy along with it.
How can FED withdraw a huge amount of money within a short time span? When FED creates money, it does not give the money away for free. It always takes the form of lending the money to someone. The collateral FED receives are mostly U. S. Treasuries. FED just sell off those U. S. Treausries to withdraw money. Such actions will cause interest rates to jump up sharply, especially short-term interest rates will rise faster than the long-term interst rates, creating a condition called "inverted yield curve". "Inverted yield curve" is a precusor that a recession is near. In other words, in order to withdraw a huge amount of money quickly, it needs to induce a recession to do so. Considering the unprecedented amount of money created by FED already, probably more than one recession will be needed to wip down M to a proper level.
What happens if the velocity of money, V, does not rise again? The right hand of Equation (1) stays constant and so is G (GDP). This means that the economy does not grow and every thing becomes stagnate. U. S. public certainly will not tolerate such a condition and will pressure FED to do something to bring back the growth. Only thing FED can do is to increase M further, and the chance of overheating increases further if the velocity V ever makes a small upward movement.
So far we have not touched the trade deficit in this section. As U. S. economy turns up, the trade deficit will surely grow again under the current set up of the globalization scheme, even if FED succeeds in bringing down M to a proper level. The question becomes who will be the middleman to recycle those trade deficit generated dollars back to consumers. If let speculators to serve as the middleman again, everything discussed in this lecture so far will all be repeated. If we forbid speculators to play the role of middleman, then only one can play the role is U. S. Government. Actually that is what U. S. Government is already doing to certain degree. The Government needs to issue a lot of Treasuries to be sold to foreigners to soak up the returning dollars, meaning to run even larger budget deficits. Then U. S. Government must redistribute the money from selling Treasuries to U. S. consumers and turn the free market system into a giant social welfare system. Since Government is an inefficient body to do this kind of jobs, we should expect the velocity of money will slow down. Only way to increase the amount that U. S. consumers can spend is to increase the trade deficit further and further. What will happen at the end of this kind of system? We recommend interested parties to read a dialogue between two men in article 7 on our website, forcastglobaleconomy.com.
In the original notes, the runaway U. S. trade deficits are always equated as the globalization process, but without explanation. The reason of that equivalence is as follows: The data shows that the sum of the trade surpluses of all trade-surplus countries around the globe is roughly equal to U. S. trade deficit. This means that if the U. S. does not run trade deficit, there will be no meaningful trade surpluses to speak of for other countries. Then there will be no strong reason for many countries to join the globalization process from the very beginning. Let us use China as an example to explain this last claim. To join the globalization process China is forced to open its market for foreign businesses to come in and compete with existing China's nationally owned businesses. As the result many such government owned businesses had failed, dismissing vast number of their workers. Even the survivors are forced to restructure and laid off workers. Why China wants to take such heavy pain to join the globalization process? It is after the potential of earning huge trade surplus. Trade surplus for China means that foreign capitals will bring in money and know how to set up factories in China, and hire many new workers to produce goods to be exported to the U. S.. Through this process a large amount of Dollar flows into China. As Chinese Government buys up those incoming dollars to keep Yuan weak in order to make continued export boom possible, vast amount of Yuan used to buy those dollars is released into Chinese society to power rampant construction boom that generates China's phenomenal GDP growth rate. In the meanwhile Chinese Government increases its foreign currency reserve at an astonishing pace. Apparently without the runaway U. S. trade deficit, joining the globalization process will only inflict damage on China but without any reward. Many countries are in similar situation as China. Therefore, without the runaway U. S. trade deficit, the globalization process will not fly. From this argument we also see that if U. S. trade deficit does not expand steadily, trade surplus countries will not be able to grow and the globalization process will be in danger.
We should note that the continued rapid growth of China in the environment of staggering U. S. trade deficit after the “Crash” is due to the influx of a huge amount of “hot” dollar, caused by Bernanke's QE1 and QE2 as will be discussed in Q & A later.
In Section 3 we have discussed the money flow through commercial banks in pre-globalization era. Actually there are two more non-bank money pools that also serve similar function as banks. The first non-bank pool is based on big block money from various business entities like insurance companies, cash rich other businesses and pension funds. The second pool is due to the government mandated taxes like payroll tax and medicare tax. The latter pool is almost exclusively lent to U. S. Government in the form of buying U. S. Treasuries and does not play a major role in causing bubble based booms so will not be discussed here further. To understand the first kind of non-bank pool, let us consider an insurance company. The company receives a vast amount of insurance premium regularly. For such large sum of money that is not earmarked for immediate usage, there is little reason to deposit them into commercial banks since FDIC insurance only covers a modest sum per account, and banks pay out interest to depositors after subtracting its own operational costs and profits. The holders of big block money like the insurance company will be better off just to lend money at hand directly to borrowers ranging from U. S. and Local Governments, businesses and even consumers. The collection of such direct lending efforts outside of commercial banks can be considered to form a non-bank money pool. Apparently this non-bank money pool also plays the role of the seed money to move the whole economy.
In the pre-globalization era Wall Street speculators were able to borrow some money from the non-bank pool. What has changed in the globalization era is the sudden surge of influx of money, due to the returning of trade-deficit-generated dollars, into the non-bank money pool that enabled wall Street speculators to borrow large amounts of money since the demand from regular borrowers will not expand so rapidly in pace with the explosive runaway trade deficit.
With the rather gloomy long-term prospects, one may want to sell all the stocks. However, such action is rather too hasty. Every time when Bernanke creates abnormally large amount of money, called QE (quantitative easing), stock market rallies. This is because banks are afraid to lend to consumers so idled money leaks into the stock market. We do not know how many times QE will be repeated. Furthermore, if Bernanke withdraw money too late when an inflation bubble is start to build up below the water, stock market will have a strong rally. Only thing investors can do is to observe closely to see any sign of developing troubles, whereas hold on to stocks to ride on the rallies up.
All three bubbles in the globalization era so far were generated by the runaway U. S. trade deficit. However, even in the globalization era other kinds of bubbles are possible. The bubbles that we are worried about in Section 8 are the ones not generated by the runaway trade deficit, but are the ones due to the over-creation of money by The Federal Reserve. This kind of bubbles resemble many bubbles before 1980's, but with a totally different scale due to the unprecedented money creation after the “crash” as discussed in Section 8. This kind of bubbles are still difficult to predict due to the difficulty of measuring the velocity of money, V. Our current effort is concentrating in overcoming this barrier.
Predicting the coming burst of bubbles only indicates the time to sell. How about the time to buy? By examining past data, a powerful rally has always started within a month or so from the nadir of a recession; the nadir of a recession is the time when the economy is declining with the largest speed. However, the firm determination of the nadir of a recession can only be made about one year after the formation of the nadir, way too late for investors. What I did is to keep in mind that a powerful rally is going to come at the darkest moment, and with one eye on what The Federal Reserve was doing and the other eye on technical analysis to estimate the stock market bottom. This method worked for the crash and should have worked for all other recessions other than the 2000-2001 one (followed the burst of Dot-com bubble). In the case of 2000-2001 recession, a powerful rally did occur shortly after the nadir of the recession and continued through the end of the recession, but the rally fizzled and the stock market made a lower low about a year later, due to the sluggish economic recovery. Another case that the method should not have worked was the 1987 crash since it was not in a recession yet so there was no “the nadir” to serve as a guide. In that case only technical analysis was available as the helpful tool to search for a bottom.
We should note that to spot a recession early and estimate the stock market bottom is gauging major turning points but does not tell us what the market will do “in between”. For example, currently we are in such a “in between” period. I usually do not like to trade very much in such “in between” periods since the method I use to gauge the market, that is, combining technical analysis with keen observation about what The Federal Reserve is doing and what is the surrounding environment, still leaves many possible routes for the economy, each resulting in different outcomes for the stock market.